This is the home page for Dobrica Pavlinušić's random unstructured stuff.
-
Protect Koha from web crawlers
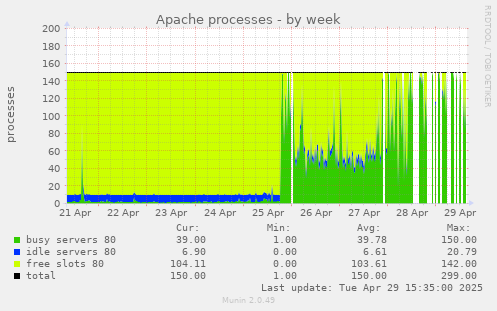
We live in troubling times, as web crawlers have become so prevalent in internet traffic that they can cause denial-of-service attacks on Koha instances.
Simplest possible way to prevent this is following rule:
    <LocationMatch "^/cgi-bin/koha/(opac-search\.pl|opac-shelves\.pl|opac-export\.pl|opac-reserve\.pl)$">
        # Block requests without a referer header
        RewriteEngine On
        RewriteCond %{HTTP_REFERER} ^$
        RewriteRule .* - [F,L]

        # Optional: Return a 403 Forbidden status code
        ErrorDocument 403 "Access Forbidden: Direct access to this resource is not allowed."
    </LocationMatch>
This helps to mitigate problems like this:
-
dspace shibboleth config and debug
Configuring shibboleth is always somewhat confusing for me, so I decided to write this blog post to document how configuration for dspace is done and debugged.
This information is scattered over documentation and dspace-tech mailing list so hopefully this will be useful to someone, at least me if I ever needed to do this again.
First step is to install mod-shib for apache:
apt install libapache2-mod-shibNow there are two files which have to be modified with your information, /etc//shibboleth/shibboleth2.xml which defines configuration and /etc/shibboleth/attribute-map.xml to define which information will be passwd from shibboleth to application.attribute-map.xml
Here we have to define headers which dspace expects, so it can get information from upstream idenitity provider.
diff --git a/shibboleth/attribute-map.xml b/shibboleth/attribute-map.xml

index 1a4a3b0..a8680da 100644

--- a/shibboleth/attribute-map.xml

+++ b/shibboleth/attribute-map.xml

@@ -163,4 +163,34 @@

     </Attribute>

     -->


+    <!-- In addition to the attribute mapping, DSpace expects the following Shibboleth Headers to be set:

+               - SHIB-NETID

+               - SHIB-MAIL

+               - SHIB-GIVENNAME

+               - SHIB-SURNAME

+             These are set by mapping the respective IdP attribute (left hand side) to the header attribute (right hand side).

+    -->

+	<Attribute name="urn:oid:0.9.2342.19200300.100.1.1" id="SHIB-NETID"/>

+	<Attribute name="urn:mace:dir:attribute-def:uid" id="SHIB-NETID"/>

+	<Attribute name="hrEduPersonPersistentID" nameFormat="urn:oasis:names:tc:SAML:2.0:attrname-format:basic" id="SHIB-NETID"/>

+

+	<Attribute name="urn:oid:0.9.2342.19200300.100.1.3" id="SHIB-MAIL"/>

+	<Attribute name="urn:mace:dir:attribute-def:mail" id="SHIB-MAIL"/>

+	<Attribute name="mail" nameFormat="urn:oasis:names:tc:SAML:2.0:attrname-format:basic" id="SHIB-MAIL"/>

+

+	<Attribute name="urn:oid:2.5.4.42" id="SHIB-GIVENNAME"/>

+	<Attribute name="urn:mace:dir:attribute-def:givenName" id="SHIB-GIVENNAME"/>

+	<Attribute name="givenName" nameFormat="urn:oasis:names:tc:SAML:2.0:attrname-format:basic" id="SHIB-GIVENNAME"/>

+

+	<Attribute name="urn:oid:2.5.4.4" id="SHIB-SURNAME"/>

+	<Attribute name="urn:mace:dir:attribute-def:sn" id="SHIB-SURNAME"/>

+	<Attribute name="sn" nameFormat="urn:oasis:names:tc:SAML:2.0:attrname-format:basic" id="SHIB-SURNAME"/>

+

 </Attributes>
shibboleth2.xml
This is main configuration file for shibd. First we need to add OutOfProcess and InProcess to include useful information in shibd.log which are very useful.
diff --git a/shibboleth/shibboleth2.xml b/shibboleth/shibboleth2.xml

index ddfb98a..7b55987 100644

--- a/shibboleth/shibboleth2.xml

+++ b/shibboleth/shibboleth2.xml

@@ -2,15 +2,46 @@

     xmlns:conf="urn:mace:shibboleth:3.0:native:sp:config"

     clockSkew="180">


-    <OutOfProcess tranLogFormat="%u|%s|%IDP|%i|%ac|%t|%attr|%n|%b|%E|%S|%SS|%L|%UA|%a" />

+    <!-- The OutOfProcess section contains properties affecting the shibd daemon. -->

+    <OutOfProcess logger="shibd.logger" tranLogFormat="%u|%s|%IDP|%i|%ac|%t|%attr|%n|%b|%E|%S|%SS|%L|%UA|%a">

+        <!--

+        <Extensions>

+            <Library path="odbc-store.so" fatal="true"/>

+        </Extensions>

+        -->

+    </OutOfProcess>


+

+    <!--

+    The InProcess section contains settings affecting web server modules.

+    Required for IIS, but can be removed when using other web servers.

+    -->

+    <InProcess logger="native.logger">

+        <ISAPI normalizeRequest="true" safeHeaderNames="true">

+            <!--

+            Maps IIS Instance ID values to the host scheme/name/port. The name is

+            required so that the proper <Host> in the request map above is found without

+            having to cover every possible DNS/IP combination the user might enter.

+            -->

+            <Site id="1" name="sp.example.org"/>

+            <!--

+            When the port and scheme are omitted, the HTTP request's port and scheme are used.

+            If these are wrong because of virtualization, they can be explicitly set here to

+            ensure proper redirect generation.

+            -->

+            <!--

+            <Site id="42" name="virtual.example.org" scheme="https" port="443"/>

+            -->

+        </ISAPI>

+    </InProcess>

+

     <!--

     By default, in-memory StorageService, ReplayCache, ArtifactMap, and SessionCache

     are used. See example-shibboleth2.xml for samples of explicitly configuring them.

     -->


     <!-- The ApplicationDefaults element is where most of Shibboleth's SAML bits are defined. -->

-    <ApplicationDefaults entityID="https://sp.example.org/shibboleth"

+    <ApplicationDefaults entityID="https://repository.clarin.hr/Shibboleth.sso/Metadata"

         REMOTE_USER="eppn subject-id pairwise-id persistent-id"

         cipherSuites="DEFAULT:!EXP:!LOW:!aNULL:!eNULL:!DES:!IDEA:!SEED:!RC4:!3DES:!kRSA:!SSLv2:!SSLv3:!TLSv1:!TLSv1.1">


@@ -31,8 +62,8 @@

             entityID property and adjust discoveryURL to point to discovery service.

             You can also override entityID on /Login query string, or in RequestMap/htaccess.

             -->

-            <SSO entityID="https://idp.example.org/idp/shibboleth"

-                 discoveryProtocol="SAMLDS" discoveryURL="https://ds.example.org/DS/WAYF">

+            <SSO

+	         discoveryProtocol="SAMLDS" discoveryURL="https://discovery.clarin.eu">

               SAML2

             </SSO>


@@ -68,6 +99,10 @@

         <!--

         <MetadataProvider type="XML" validate="true" path="partner-metadata.xml"/>

         -->

+	<MetadataProvider type="XML" url="https://login.aaiedu.hr/shib/saml2/idp/metadata.php" backingFilePath="aaieduhr-metadata.xml" maxRefreshDelay="3600" />


         <!-- Example of remotely supplied batch of signed metadata. -->

         <!--
certificates
To make upstream identity provider connect to us, we need valid certificate so we need /etc//shibboleth/sp-encrypt-cert.pem and /etc/shibboleth/sp-encrypt-key.pem.
Since we are using Let's encrypt for certificates, I'm using shell script to move them over and change permissions so shibd will accept them.dpavlin@repository:/etc/shibboleth$ cat update-certs.sh #!/bin/sh -xe cp -v /etc/letsencrypt/live/repository.clarin.hr/privkey.pem sp-encrypt-key.pem cp -v /etc/letsencrypt/live/repository.clarin.hr/cert.pem sp-encrypt-cert.pem chown -v _shibd:_shibd sp-*.pem /etc/init.d/shibd restart
dspace configuration
We are using upstream dspace docker which includes local.cfg from outside using docker bind, but also re-defines shibboleth headers so we need to restore them to default names defined before in /etc/shibboleth/attribute-map.xml.
diff --git a/docker/local.cfg b/docker/local.cfg

index 168ab0dd42..6f71be32cf 100644

--- a/docker/local.cfg

+++ b/docker/local.cfg

@@ -14,3 +14,22 @@

 # test with: /dspace/bin/dspace dsprop -p rest.cors.allowed-origins


 handle.prefix = 20.500.14615

+

+shibboleth.discofeed.url = https://repository.clarin.hr/Shibboleth.sso/DiscoFeed

+

+plugin.sequence.org.dspace.authenticate.AuthenticationMethod = org.dspace.authenticate.PasswordAuthentication

+plugin.sequence.org.dspace.authenticate.AuthenticationMethod = org.dspace.authenticate.ShibAuthentication

+

+# in sync with definitions from /etc/shibboleth/attribute-map.xml

+authentication-shibboleth.netid-header = SHIB-NETID

+authentication-shibboleth.email-header = SHIB-MAIL

+authentication-shibboleth.firstname-header = SHIB-GIVENNAME

+authentication-shibboleth.lastname-header = SHIB-SURNAME

+# Should we allow new users to be registered automatically?

+authentication-shibboleth.autoregister = true
example of working login
==> /var/log/shibboleth/shibd.log <==

2024-11-18 17:18:40 INFO XMLTooling.StorageService : purged 2 expired record(s) from storage


==> /var/log/shibboleth/transaction.log <==

2024-11-18 17:27:42|Shibboleth-TRANSACTION.AuthnRequest|||https://login.aaiedu.hr/shib/saml2/idp/metadata.php||||||urn:oasis:names:tc:SAML:2.0:bindings:HTTP-POST||||||


==> /var/log/shibboleth/shibd.log <==

2024-11-18 17:27:42 INFO Shibboleth.SessionCache [1] [default]: new session created: ID (_e37d7f0b8ea3ff4d718b3e2c68d81e45) IdP (https://login.aaiedu.hr/shib/saml2/idp/metadata.php) Protocol(urn:oasis:names:tc:SAML:2.0:protocol) Address (141.138.31.16)


==> /var/log/shibboleth/transaction.log <==

2024-11-18 17:27:42|Shibboleth-TRANSACTION.Login|https://login.aaiedu.hr/shib/saml2/idp/metadata.php!https://repository.clarin.hr/Shibboleth.sso/Metadata!303a3b0f72c5e29bcbdf35cab3826e62|_e37d7f0b8ea3ff4d718b3e2c68d81e45|https://login.aaiedu.hr/shib/saml2/idp/metadata.php|_3b8a8dc87db05b5e6abf8aaf9d5c67e6ebc62a2eed|urn:oasis:names:tc:SAML:2.0:ac:classes:PasswordProtectedTransport|2024-11-18T17:01:57|SHIB-GIVENNAME(1),SHIB-MAIL(2),SHIB-NETID(1),SHIB-SURNAME(1),persistent-id(1)|303a3b0f72c5e29bcbdf35cab3826e62|urn:oasis:names:tc:SAML:2.0:bindings:HTTP-POST||urn:oasis:names:tc:SAML:2.0:status:Success|||Mozilla/5.0 (X11; Linux x86_64; rv:134.0) Gecko/20100101 Firefox/134.0|141.138.31.16
boken urf-8 in shibboleth user first name or surname
You might think that now everything works, but dspace will try to re-encode utf-8 characters received from upstream shibboleth using iso-8859-1 breaking accented characters in process. It has configuration for it, but by default it's false.
root@4880a3097115:/usr/local/tomcat/bin# /dspace/bin/dspace dsprop -p authentication-shibboleth.reconvert.attributes

false
So we need to modify dspace-angular/docker/local.cfg and turn it on:
# incomming utf-8 from shibboleth AAI

authentication-shibboleth.reconvert.attributes=true
-
WordPress comment spam - what to do about it and how
Let's assume that you inherited WordPress installation (or three) with tens of instances (or hundreds in this case) which are generating spam using comments. I will try to describe problem here and suggest solution which doesn't require clicking in WordPress but instead using wp cli which is faster and easier especially if you don't have administrative account on all those WordPress instances. Interested? Read on.
WordPress comment spam
If you try googling around how to prevent WordPress comment spam, you will soon arrive at two solutions:
- changing default_comment_status to closed which will apply to all new posts
- changing comment_status on all existing posts to close
So, in summary, all this can easily be done using following commands in wp cli:
wp post list --post-status=publish --post_type=post --comment_status=open --format=ids \
        | xargs -d ' ' -I % wp post update % --comment_status=closed

wp option update default_comment_status closed

wp option update close_comments_for_old_posts 1
If wp cli doesn't work for you (for example if your WordPress instance is so old that wp cli is returning errors for some plugins instead of working) you can achieve same thing using SQL (this assumes that wp db query is working, but if it doesn't you can always connect using mysql and login and password from wp-config.php):
cat << __SQL__ | wp db query
update wp_posts set comment_status='closed' where comment_status != 'closed' ;
update wp_options set option_value = 'closed' where option_name = 'default_comment_status' and option_value != 'closed' ;
update wp_options set option_value = 1 where option_name = 'close_comments_for_old_posts' and option_value != 1
__SQL__
This is also faster option, because all SQL SQL queries are invoked using single wp db query call (and this since php instance startup which can time some time).Cleaning up held or spam comments
After you disabled new spam in comments, you will be left with some amount of comments which are marked as spam or left in held status if your WordPress admins didn't do anything about them. To cleanup database, you can use following to delete spam or held comments:
wp comment delete $(wp comment list --status=spam --format=ids) --force

wp comment delete $(wp comment list --status=hold --format=ids) --force
Disabling contact form spam
All spam is not result of comments, some of it might come through contact form. To disable those, you can disable comment plugin which will leave ugly markup on page without it enabled, but spams will stop.
# see which contact plugins are active
wp plugin list | grep contact
contact-form-7  active  none    5.7.5.1
contact-form-7-multilingual     active  none    1.2.1

# disable them
wp plugin deactivate contact-form-7
-
freeradius testing and logging
If you are put in front of working radius server which you want to upgrade, but this is your first encounter with radius, following notes might be useful to get you started.
Goal is to to upgrade system and test to see if everything still works after upgrade.radtest
First way to test radius is radtest which comes with freeradius and enables you to verify if login/password combination results in successful auth.
You have to ensure that you have 127.0.0.1 client in our case in /etc/freeradius/3.0/clients-local.conf file:
client 127.0.0.1 {
    ipv4addr    = 127.0.0.1
    secret      = testing123
    shortname   = test-localhost
}
Restart freeradius and test# systemctl restart freeradius # radtest username@example.com PASSword 127.0.0.1 0 testing123 Sent Access-Request Id 182 from 0.0.0.0:45618 to 127.0.0.1:1812 length 86 User-Name = "username@example.com" User-Password = "PASSword" NAS-IP-Address = 193.198.212.8 NAS-Port = 0 Message-Authenticator = 0x00 Cleartext-Password = "PASSword" Received Access-Accept Id 182 from 127.0.0.1:1812 to 127.0.0.1:45618 length 115 Connect-Info = "NONE" Configuration-Token = "djelatnik" Callback-Number = "username@example.com" Chargeable-User-Identity = 0x38343431636162353262323566356663643035613036373765343630333837383135653766376434 User-Name = "username@example.com" # tail /var/log/freeradius/radius.log Tue Dec 27 19:41:15 2022 : Info: rlm_ldap (ldap-aai): Opening additional connection (11), 1 of 31 pending slots used Tue Dec 27 19:41:15 2022 : Auth: (9) Login OK: [user@example.com] (from client test-localhost port 0)This will also test connection to LDAP in this case.radsniff -x
To get dump of radius traffic on production server to stdout, use radsniff -x.
This is useful, but won't get you encrypted parts of EAP.
freeradius logging
To see all protocol decode from freeradius, you can run it with -X flag in terminal which will run it in foreground with debug output.
# freeradius -X
If you have ability to run isolated freeradius for testing, this is easiest way to see all configuration parsed (and warnings!) and decoded EAP traffic.generating more verbose log file
Adding -x to /etc/default/freeradius or to radius command-line will generate debug log in log file. Be mindful about disk space usage for additional logging! But to see enough debugging in logs to see which EAP type is unsupported like:
dpavlin@deenes:~/radius-tools$ grep 'unsupported EAP type' /var/log/freeradius/radius.log
(27) eap-aai: Peer NAK'd asking for unsupported EAP type PEAP (25), skipping...
(41) eap-aai: Peer NAK'd asking for unsupported EAP type PEAP (25), skipping...
(82) eap-aai: Peer NAK'd asking for unsupported EAP type PEAP (25), skipping...
(129) eap-aai: Peer NAK'd asking for unsupported EAP type PEAP (25), skipping...
(142) eap-aai: Peer NAK'd asking for unsupported EAP type PEAP (25), skipping...
you will need to use -xx (two times x) to get enough debugging log. Again, monitor disk usage carefully.EAP radius testing using eapol_test from wpa_supplicant
To test EAP we need to build eapol_test tool from wpa_supplicant.
wget http://w1.fi/releases/wpa_supplicant-2.10.tar.gz cd wpa_supplicant-
/wpa_supplicant $ cp defconfig .config $ vi .config CONFIG_EAPOL_TEST=y # install development libraries needed apt install libssl-dev libnl-3-dev libnl-genl-3-dev libnl-route-3-dev make eapol_test EAP/TTLS
Now ne need configuration file for wpa_supplicant which tests EAP:
ctrl_interface=/var/run/wpa_supplicant
ap_scan=1

network={
    ssid="eduroam"
    proto=WPA2
    key_mgmt=WPA-EAP
    pairwise=CCMP
    group=CCMP
    eap=TTLS
    anonymous_identity="anonymous@example.com"
    phase2="auth=PAP"
    identity="username@example.com"
    password="PASSword"
}
Now we can test against our radius server (with optional certificate test):# ./wpa_supplicant-2.10/wpa_supplicant/eapol_test -c ffzg.conf -s testing123
and specifying your custom CA cert:# ./wpa_supplicant-2.10/wpa_supplicant/eapol_test -c ffzg.conf -s testing123 -o /etc/freeradius/3.0/certs/fRcerts/server-cert.pem
This will generate a lot of output, but in radius log you should seeTue Dec 27 20:00:33 2022 : Auth: (9) Login OK: [username@example.com] (from client test-localhost port 0 cli 02-00-00-00-00-01 via TLS tunnel) Tue Dec 27 20:00:33 2022 : Auth: (9) Login OK: [username@example.com] (from client test-localhost port 0 cli 02-00-00-00-00-01)
GTC
This seems like a part of tibial knowledge (passed to me by another sysadmin), but to make GTC work, change of default_eap_type to gtc under ttls and add gtc section:
        ttls {
                # ... rest of config...
                default_eap_type = gtc
                # ... rest of config...
        }

        gtc {
                challenge = "Password: "
                auth_type = LDAP
        }
and changing wpa-supplicant configuration to:CLONE dupli deenes:/home/dpavlin# cat eduroam-ttls-gtc.conf ctrl_interface=/var/run/wpa_supplicant ap_scan=1 network={ ssid="eduroam" proto=WPA2 key_mgmt=WPA-EAP pairwise=CCMP group=CCMP eap=TTLS anonymous_identity="anonymous@example.com" phase2="autheap=GTC" identity="username@example.com" password="PASSword" }PEAP
To make PEAP GTC work, I needed to add:
diff --git a/freeradius/3.0/mods-available/eap-aai b/freeradius/3.0/mods-available/eap-aai
index 245b7eb..6b7cefb 100644
--- a/freeradius/3.0/mods-available/eap-aai
+++ b/freeradius/3.0/mods-available/eap-aai
@@ -73,5 +73,11 @@ eap eap-aai {
                auth_type = LDAP
        }

+       # XXX 2023-01-06 dpavlin - peap
+       peap {
+               tls = tls-common
+               default_eap_type = gtc
+               virtual_server = "default"
+       }

 }
which then can be tested with:network={ ssid="wired" key_mgmt=IEEE8021X eap=PEAP anonymous_identity="anonymous@example.com" identity="username@example.com" password="PASSword" } -
Local domains and caching bind server without Internet connection
What do do when you have bind as caching resolver which forwards to your DNS servers which do recursive resolving and host primary and secondary of your local domains and upstream link goes down?
To my surprise, caching server can't resolve your local domains although both primary and secondary of those domains are still available on your network and can resolve your domains without problem (when queried directly).
That's because caching server tries to do recursive resolving using root servers which aren't available if your upstream link is down, so even your local domains aren't available to clients using caching server.
Solution is simple if you know what it is. Simply add your local zones on caching server with type forward:
zone "ffzg.hr" {
    type forward;
    forwarders {
        193.198.212.8;
        193.198.213.8;
    };
};

zone "ffzg.unizg.hr" {
    type forward;
    forwarders {
        193.198.212.8;
        193.198.213.8;
    };
};
This will work, since queries for those zones are no longer recursive queries, so they don't need root servers which aren't available without upstream link. -
dovecot maildir on compressed zfs pool
This is a story about our mail server which is coming close to it's disk space capacity:
root@mudrac:/home/prof/dpavlin# df -h
Filesystem      Size  Used Avail Use% Mounted on
/dev/vda1        20G  7.7G   11G  42% /
/dev/vdb        4.0T  3.9T   74G  99% /home
/dev/vdc        591G  502G   89G  85% /home/stud
You might say that it's easy to resize disk and provide more storage, but unfortunately it's not so easy. We are using ganeti for our virtualization platform, and current version of ganeti has limit of 4T for single drbd disk.
This can be solved by increasing third (vdc) disk and moving some users to it, but this is not ideal. Another possibility is to use dovecot's zlib plugin to compress mails. However, since our Maildir doesn't have required S=12345 as part of filename to describe size of mail, this solution also wasn't applicable to us.
Installing lvm would allow us to use more than one disk to provide additional storage, but since ganeti already uses lvm to provide virtual disks to instance this also isn't ideal.
OpenZFS comes to rescue
Another solution is to use OpenZFS to provide multiple disks as single filesystem storage, and at the same time provide disk compression. Let's create a pool:
zpool create -o ashift=9 mudrac /dev/vdb
zfs create mudrac/mudrac
zfs set compression=zstd-6 mudrac
zfs set atime=off mudrac
We are using ashift of 9 instead of 12 since it uses 512 bytes blocks on storage (which is supported by our SSD storage) that saves quite a bit of space:root@t1:~# df | grep mudrac Filesystem 1K-blocks Used Available Use% Mounted on mudrac/mudrac 3104245632 3062591616 41654016 99% /mudrac/mudrac # ashift=12 m2/mudrac 3104303872 2917941376 186362496 94% /m2/mudrac # ashift=9
This is saving of 137Gb just by choosing smaller ashift.Most of our e-mail are messages kept on server, but rarely accessed. Because of that I opted to use zstd-6 (instead of default zstd-3) to compress it as much as possible. But, to be sure it's right choice, I also tested zstd-12 and zstd-19 and results are available below:
Compression levels higher than 6 seem to need at least 6 cores to compress data, so zstd-6 seemed like best performance/space tradeoff, especially if we take into account additional time needed for compression to finish.LEVEL USED COMP H:S zstd-6 2987971933184 60% 11:2400 zstd-12 2980591115776 59% 15:600 zstd-19 2972514841600 59% 52:600 bullseye kernel for zfs and systemd-nspawn
To have zfs, we need recent kernel. Instead of upgrading whole server to bullseye at this moment, I decided to boot bullseye with zfs and start unmodified installation using systemd-nspawn. This is easy using following command line:
systemd-nspawn --directory /mudrac/mudrac/ --boot --machine mudrac --network-interface=eth1010 --hostname mudrac
but it's not ideal for automatic start of machine, so better solution is to use machinectl and systemd service for this. Converting this command-line into nspawn is non-trivial, but after reading man systemd.nspawn configuration needed is:root@t1:~# cat /etc/systemd/nspawn/mudrac.nspawn [Exec] Boot=on #WorkingDirectory=/mudrac/mudrac # ln -s /mudrac/mudrac /var/lib/machines/ # don't chown files PrivateUsers=false [Network] Interface=eth1010
Please note that we are not using WorkingDirectory (which would copy files from /var/lib/machines/name) but instead just created symlink to zfs filesystem in /var/lib/machines/.To enable and start container on boot, we can use:
systemctl enable systemd-nspawn@mudrac
systemctl start systemd-nspawn@mudrac
Keep network device linked to mac address
Predictable network device names which bullseye uses should provide stable network device names. This seems like clean solution, but in testing I figured out that adding additional disks will change name of network devices. Previously Debian used udev to provide mapping between network interface name and device mac using /etc/udev/rules.d/70-persistent-net.rules. Since this is no longer the case, solution is to define similar mapping using systemd network like this:
root@t1:~# cat /etc/systemd/network/11-eth1010.link
[Match]
MACAddress=aa:00:00:39:90:0f

[Link]
Name=eth1010
Increasing disk space
When we do run out of disk space again, we could add new disk and add it to zfs pool using:
root@t2:~# zpool set autoexpand=on mudrac
root@t2:~# zpool add mudrac /dev/vdc
Thanks to autoexpand=on above, this will automatically make new space available. However, if we increase existing disk up to 4T new space isn't visible immediately since zfs has partition table on disk, so we need to extend device to use all space available using:root@t2:~# zpool online -e mudrac vdb
zfs snapshots for backup
Now that we have zfs under our mail server, it's logical to also use zfs snapshots to provide nice, low overhead incremental backup. It's as easy as:
zfs snap mudrac/mudrac@$( date +%Y-%m-%d )
in cron.daliy and than shipping snapshots to backup machine. I did look into existing zfs snapshot solutions, but they all seemed a little bit too complicated for my use-case, so I wrote zfs-snap-to-dr.pl which copies snapshots to backup site.To keep just and two last snapshots on mail server simple shell snippet is enough:
zfs list -r -t snapshot -o name -H mudrac/mudrac > /dev/shm/zfs.all
tail -2 /dev/shm/zfs.all > /dev/shm/zfs.tail-2
grep -v -f /dev/shm/zfs.tail-2 /dev/shm/zfs.all | xargs -i zfs destroy {}
Using shell to create and expire snapshots and simpler script to just transfer snapshots seems to me like better and more flexible solution than implementing it all in single perl script. In a sense, it's the unix way of small tools which do one thing well. Only feature which zfs-snap-to-dr.pl has aside from snapshot transfer is ability to keep just configurable number of snapshots on destination which enables it to keep disk usage under check (and re-users already collected data about snapshots). This was interesting journey. In future, we will migrate mail server to bullseye and remove systemd-nspawn (it feels like we are twisting it's hand using it like this). But it does work, and is simple solution which will come handy in future. -
Track your configuration using git
I have a confession to make: etckeeper got me spoiled. I really like ability to track changes in git and have it documented in git log. However, this time I was working on already installed machine which didn't have much files in /etc for etckeeper, but I wanted to have peace of mind with configuration in git.
This got me thinking: I could create git in root (/) of file-system and than track any file using it. Since this is three servers I could also use other two nodes to make a backup of configuration by pushing to them.
To make this working first I need to do init git repository and create branch with same name as short version of hostname (this will allow us to push and pull with unique branch name on each machine):
# cd /
# git init
# git checkout -b $( hostname -s )
With this done, all I have to do now is add and commit a file that I want to change (to preserve original version), make changes and commit it after change. To make first step easier, I created script which allows me to do git ac /path/to/file that will add file to git and commit original version in just one command (ac = add+commit).# cat /usr/local/bin/git-ac #!/bin/sh git add $* git commit -m $1 $*
With this in place, I now have nice log of one server. Now it's time to repeat it on each machine and use git remote add host1 host1:/.git to add other hosts.Since I have some commits in branch with short hostname, it's also right moment to issue git branch -d master to remove master branch which we don't use (and will clutter out output later).
We can fetch branches from other servers manually, but since we already have that information in git remote I wrote another quick script:
# cat /usr/local/bin/git-f
git remote | xargs -i git fetch {}
With this I can issue just git f to fetch all branches on all hosts. If I want to push changes to other nodes, I can do git p which is similar script:# cat /usr/local/bin/git-p # disable push with git remote set-url --push pg-edu no_push git remote | xargs -i git push {} $( hostname -s )There is also a note how to disable push to some remote (if you don't want to have full history there, but want to pull from it).With this in place, you will get nice log of changes in git, and since every host hast branch of all other hosts, you can even use git cherry-pick to get same change on multiple hosts. Last useful hint is to use git branch -va which will show all branches together with sha of last commit which can be used to cherry pick last commit. If you need older commits, you can always issue git log on remote branch and pick up commit that you need.
Last step is to add cron job in cron.daily to commit changes daily which you forgot to commit:
# cat /etc/cron.daily/cron-commit
#!/bin/sh

cd /
git commit -m $( date +%Y-%m-%dT%H%M%S ) -a
With everything documented here, you have easy to use git in which you can track changes of any file on your file-system. There is one additional note: if file that you want to track is on nfs mount, you will need to add and commit it from outside of nfs mount (specifying full path to file on nfs) because if you are inside nfs mount git will complain that there is no git repository there. -
mysql database with latin1 charset and utf8 data
I know that it's 2021, but we are still having problems with encoding in mysql (MariaDB in this cane, but problem is smilar). This time, it's application which I inherited which saves utf-8 data into database which is declared as latin1.
How can you check if this is problem with your database too?
MariaDB [ompdb]> show create database ompdb ;
+----------+------------------------------------------------------------------+
| Database | Create Database                                                  |
+----------+------------------------------------------------------------------+
| ompdb    | CREATE DATABASE `ompdb` /*!40100 DEFAULT CHARACTER SET latin1 */ |
+----------+------------------------------------------------------------------+
Alternative way is to invoke mysqldump ompdb and example file generated. Why is this a problem? If we try SQL query on one of tables:MariaDB [ompdb]> select * from submission_search_keyword_list where keyword_text like 'al%ir' ; +------------+--------------+ | keyword_id | keyword_text | +------------+--------------+ | 3657 | alzir | | 1427 | alžir | +------------+--------------+
You can clearly see double-encoded utf8 which should be alžir. This is because our client is connecting using utf8 charset, getting utf8 data in binary form so we see double-encoding. So we can try to conntect using latin1 with:root@omp-clone:/home/dpavlin# mysql --default-character-set=latin1 ompdb MariaDB [ompdb]> select * from submission_search_keyword_list where keyword_text like 'al%ir' ; +------------+--------------+ | keyword_id | keyword_text | +------------+--------------+ | 3657 | alzir | | 1427 | alžir | +------------+--------------+
Note that everything is still not well, because grid after our utf8 data is not aligned well.Googling around, you might find that possible solution is to add --default-character-set=latin1 to mysqldump, edit all occurrences of latin1 to utf8 (utf8mb4 is better choice) and reload database, and problem is solved, right?
If we try to do that, we will get following error:
ERROR 1062 (23000) at line 1055 in file: '1.sql': Duplicate entry 'alžir' for key 'submission_search_keyword_text'
Why is this? MySQL uses collation setting to remove accents from data, so it treats alzir and alžir as same string. Since we have both of them in our data, this is not good enough. Also, editing database manually always makes me nervous, so we will using following to get database dump without declaration of encoding (due to --skip-opt option), but using latin1 for dumping data:mysqldump ompdb --skip-set-charset --default-character-set=latin1 --skip-opt > /tmp/1.sql
Next, we need to create database with collation which preserves everything (utf8mb4_bin) using:CREATE DATABASE omp2 CHARACTER SET = 'utf8mb4' COLLATE 'utf8mb4_bin' ;
Finally we should be able to reload created dump without errors:mysql omp2 < /tmp/1.sql
One additional benefit of using --skip-opt for mysqldump is that every insert is split into individual line. So if you want to have correct collation and skip data which is invalid (which might be possible depending on where data is) you can use same mysqldump file and add -f flag when reloading dump like mysql -f omp2 < /tmp/1.sql which will report data that have errors, but insert everything else into database.
-
request tracker where ldap users have multiple mail addresses
We have been using request tracker for years but recently changed how many e-mail addresses we keep in LDAP mail attribute. Up until now, we stored just our local e-mail addresses there, but lately we also added external addresses that our users have.
This created a problem when users try to send e-mail from external address to our rt. To test this, I have account usertest which has dpavlin@example.com as first mail in LDAP and dpavlin@m.example.com as second one and I'm sending e-mail from dpavlin@m.example.com like this:
swaks --to sysadmin@rt.example.com --from dpavlin@m.example.com
Result is following log which seems very verbose, but is also useful in understanding what is going wrong:
[14188] [Fri Apr 16 07:57:26 2021] [debug]: Going to create user with address 'dpavlin@m.example.com' (/usr/local/share/request-tracker4/lib/RT/Interface/Email/Auth/MailFrom.pm:100)
[14188] [Fri Apr 16 07:57:26 2021] [debug]: RT::Authen::ExternalAuth::CanonicalizeUserInfo called by RT::Authen::ExternalAuth /usr/local/share/request-tracker4/plugins/RT-Authen-ExternalAuth/lib/RT/Authen/ExternalAuth.pm 886 with: Comments: Autocreated on ticket submission, Disabled: , EmailAddress: dpavlin@m.example.com, Name: dpavlin@m.example.com, Password: , Privileged: , RealName: (/usr/local/share/request-tracker4/plugins/RT-Authen-ExternalAuth/lib/RT/Authen/ExternalAuth.pm:793)
[14188] [Fri Apr 16 07:57:26 2021] [debug]: Attempting to get user info using this external service: FFZG_LDAP (/usr/local/share/request-tracker4/plugins/RT-Authen-ExternalAuth/lib/RT/Authen/ExternalAuth.pm:801) [14188] [Fri Apr 16 07:57:26 2021] [debug]: Attempting to use this canonicalization key: Name (/usr/local/share/request-tracker4/plugins/RT-Authen-ExternalAuth/lib/RT/Authen/ExternalAuth.pm:810)
[14188] [Fri Apr 16 07:57:26 2021] [debug]: LDAP Search === Base: dc=ffzg,dc=hr == Filter: (&(objectClass=*)(uid=dpavlin@m.example.com)) == Attrs: co,uid,postalCode,physicalDeliveryOfficeName,uid,streetAddress,telephoneNumber,hrEduPersonUniqueID,cn,l,st,mail (/usr/local/share/request-tracker4/plugins/RT-Authen-ExternalAuth/lib/RT/Authen/ExternalAuth/LDAP.pm:358)
[14188] [Fri Apr 16 07:57:26 2021] [debug]: Attempting to use this canonicalization key: EmailAddress (/usr/local/share/request-tracker4/plugins/RT-Authen-ExternalAuth/lib/RT/Authen/ExternalAuth.pm:810)
[14188] [Fri Apr 16 07:57:26 2021] [debug]: LDAP Search === Base: dc=ffzg,dc=hr == Filter: (&(objectClass=*)(mail=dpavlin@m.example.com)) == Attrs: co,uid,postalCode,physicalDeliveryOfficeName,uid,streetAddress,telephoneNumber,hrEduPersonUniqueID,cn,l,st,mail (/usr/local/share/request-tracker4/plugins/RT-Authen-ExternalAuth/lib/RT/Authen/ExternalAuth/LDAP.pm:358)
[14188] [Fri Apr 16 07:57:26 2021] [info]: RT::Authen::ExternalAuth::CanonicalizeUserInfo returning Address1: , City: Zagreb, Comments: Autocreated on ticket submission, Country: , Disabled: , EmailAddress: dpavlin@example.com, ExternalAuthId: usertest@example.com, Gecos: usertest, Name: usertest, Organization: , Password: , Privileged: , RealName: TestiÄiÄ ProbiÅ¡iÄ Äž, State: , WorkPhone: 014092209, Zip: (/usr/local/share/request-tracker4/plugins/RT-Authen-ExternalAuth/lib/RT/Authen/ExternalAuth.pm:869)
[14188] [Fri Apr 16 07:57:26 2021] [crit]: User could not be created: User creation failed in mailgateway: Name in use (/usr/local/share/request-tracker4/lib/RT/Interface/Email.pm:243)
[14188] [Fri Apr 16 07:57:26 2021] [warning]: Couldn't load user 'dpavlin@m.example.com'.giving up (/usr/local/share/request-tracker4/lib/RT/Interface/Email.pm:876)
[14188] [Fri Apr 16 07:57:26 2021] [crit]: User could not be loaded: User 'dpavlin@m.example.com' could not be loaded in the mail gateway (/usr/local/share/request-tracker4/lib/RT/Interface/Email.pm:243)
[14188] [Fri Apr 16 07:57:26 2021] [error]: Could not load a valid user: RT could not load a valid user, and RT's configuration does not allow for the creation of a new user for this email (dpavlin@m.example.com). You might need to grant 'Everyone' the right 'CreateTicket' for the queue SysAdmin. (/usr/local/share/request-tracker4/lib/RT/Interface/Email.pm:243)I'm aware that lines are long, and full of data but they describe problem quite well:
- RT tries to find user with e-mail address dpavlin@m.example.com (which doesn't exist since RT uses just first e-mail from LDAP which is dpavlin@example.com)
- then it tries to create new user with dpavlin@m.example.com, but runs another search over ldap to make sure it won't create duplicate user
- this will find user in ldap due to second email adress and gives wrong error message.
--- /usr/share/request-tracker4/plugins/RT-Authen-ExternalAuth/lib/RT/Authen/ExternalAuth/LDAP.pm.orig  2017-04-05 14:57:22.932000146 +0200
+++ /usr/share/request-tracker4/plugins/RT-Authen-ExternalAuth/lib/RT/Authen/ExternalAuth/LDAP.pm       2021-04-16 15:49:34.800001819 +0200
@@ -429,6 +429,12 @@
                                 $ldap_msg->code);
     }

+    # FIXME -- dpavlin 2021-04-16 -- check if e-mail from ldap is same as incomming one
+    if ( $key eq 'mail' && $value ne $params{EmailAddress}) {
+       $RT::Logger->debug( "LDAP mail check return not found key = $key value = $value $params{EmailAddress}");
+       $found = 0;
+    }
+
     undef $ldap;
     undef $ldap_msg;
If e-mail address we found in LDAP is not the same one we did lookup on in CanonicalizeUserInfo we just ignore it.I think that nicely shows power of good logs and open source software written in scripting language which you can modify in the place for your (slightly broken) configuration.
-
openocd, raspberry pi and unknown stm32
If you ever needed to connect to JTAG or SWD on stm32 and tried to search for solutions on Internet, you quickly realized that amount of information is overwhelming. However, fear not. If you have Raspberry Pi and few wires, you are already half-way there.
For me, this whole adventure started when I got non-working sensor which had swd header and blob over chip. This was not my first swd experiment. Thanks to great Hackaday Remoticon 2020 The Hackers Guide to Hardware Debugging by Matthew Alt I had already tried to connect using swd from Raspberry Pi to bluepill (which is stm32f103) so I had some experience with that. Now I also had unknown device so I can try what I can do with it.
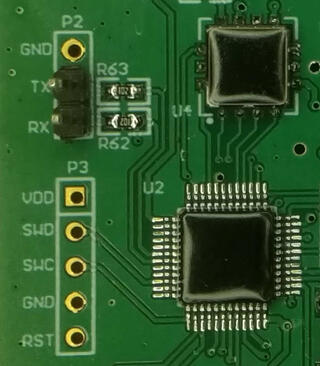
For a start, you can notice that device have UART TX and RX pins already soldered, so first step was to connect normal 3.3V serial to those pins and see if we have some output. And I did. I could see that it's contacting sensor chip and trying to initiate NBIoT connection, but fails. So next step was to solder SWD pins, and connect them to Raspberry Pi. For that, I created openocd configuration rpi4-zc-swd.cfg and uncommeted bottom of configuration to get first idea what chip is on the board (since it's covered with blob):
swd newdap chip cpu -enable
dap create chip.dap -chain-position chip.cpu
target create chip.cpu cortex_m -dap chip.dap
init
dap info
I did made some assumptions where, for example that chip is cortex_m, but since it has swd header, there was a good chance it was.However, since this sensor tries to get measurements in some configurable interval, just connecting using openocd didn't work since sensor after power up and sensor check went into sleep. While I could re-plug sensor repeatably, this is not needed since there is also rst pin (connected to pin 22 on Raspberry pi) which we can toggle from shell using:
raspi-gpio set 22 op
raspi-gpio get 22
raspi-gpio set 22 dl
raspi-gpio get 22
raspi-gpio set 22 dh
raspi-gpio get 22
This woke up sensor again, and I was able to connect to it using openocd and was greeted with following output:root@rpi4:/home/pi/openocd-rpi2-stm32# openocd -f rpi4-zc-swd.cfg Open On-Chip Debugger 0.11.0+dev-00062-g6405d35f3-dirty (2021-03-27-16:05) Licensed under GNU GPL v2 For bug reports, read http://openocd.org/doc/doxygen/bugs.html Info : BCM2835 GPIO JTAG/SWD bitbang driver Info : clock speed 100 kHz Info : SWD DPIDR 0x0bc11477 Info : chip.cpu: hardware has 4 breakpoints, 2 watchpoints Info : starting gdb server for chip.cpu on 3333 Info : Listening on port 3333 for gdb connections AP ID register 0x04770031 Type is MEM-AP AHB3 MEM-AP BASE 0xf0000003 Valid ROM table present Component base address 0xf0000000 Peripheral ID 0x00000a0447 Designer is 0x0a0, STMicroelectronics Part is 0x447, Unrecognized Component class is 0x1, ROM table MEMTYPE system memory present on busSo, indeed this was STMicroelectronics chip, but unknown model. However, using Info : SWD DPIDR 0x0bc11477 and googling that I figured out that it's probably STM32L0xx which again made sense.So I started openocd -f rpi4-zc-swd.cfg -f target/stm32l0_dual_bank.cfg and telnet 4444 to connect to it and I was able to dump flash. However, I had to be quick since sensor will power off itself after 30 seconds or so. Solution was easy, I toggled again rst pin and connected using gdb which stopped cpu and left sensor powered on.
However, all was not good since quick view into 64K dump showed that at end of it there was partial AT command, so dump was not whole. So I opened STM32L0x1 page and since mcu was LQFP 48 with 128k my mcu was STM32L081CB. So I restarted openocd -f rpi4-zc-swd.cfg -f target/stm32l0_dual_bank.cfg and got two flash banks:
> flash banks
#0 : stm32l0.flash (stm32lx) at 0x08000000, size 0x00010000, buswidth 0, chipwidth 0
#1 : stm32l0.flash1 (stm32lx) at 0x08010000, size 0x00010000, buswidth 0, chipwidth 0
So I was able to dump them both and got full firmware. It was also very useful, because at one point I did write flash in gdb instead in telnet 4444 connection and erased one of sensors which I was able to recover using dump which I obtained.This however, produced another question for me: since flash is same on all sensors, where are setting which can be configured in sensor (and wasn't changed by re-flashing firmware). Since chip also has 6k of eeprom this was logical place to put it. However, openocd doesn't have bult-in support to dump eeprom from those chips. However, I did found post Flashing STM32L15X EEPROM with STLink under Linux which modified openocd to support reading and writing of eeprom back in 2015 but is not part of upstream openocd.
I didn't want to return to openocd from 2015 or port changes to current version, but I didn't have to. Since I was only interested in dumping eeprom I was able to dump it using normal mdw command:
> mdw 0x08080000 1536
1536 is number of 32-bit words in 6k eeprom (1536 * 4 = 6144). And indeed setting which are configurable where stored in eeprom.This was fun journey into openocd and stm32, so I hope this will help someone to get started. All configuration files are available at https://github.com/dpavlin/openocd-rpi2-stm32.
-
Grove Beginner Kit sensors show graphs using InfluxDB and Grafana
 Several months ago, I got
Grove Beginner Kit For Arduino for review. I wanted to see if this board would
be good fit for my friends which aren't into electronics to get them started with it.
Several months ago, I got
Grove Beginner Kit For Arduino for review. I wanted to see if this board would
be good fit for my friends which aren't into electronics to get them started with it.
So, I started with general idea: collect values from sensors, send them to InfluxDB and create graphs using Grafana. In my opinion, showing graphs of values from real world is good way to get started with something which is not possible without little bit of additional hardware, and might be good first project for people who didn't get to try Arduino platform until now.
Kit is somewhat special: out of the box, it comes as single board with all sensors already attached, so to start using it, you just need to connect it to any usb port (it even comes with usb cable for that purpose). It also has plastic stand-offs which will provide isolation of bottom side from surface on which it's placed.
It provides following sensors on board:
Modules Interface Pins/Address LED Digital D4 Buzzer Digital D5 OLEDDisplay 0.96" I2C I2C, 0x78(default) Button Digital D6 Rotary Potentiometer Analog A0 Light Analog A6 Sound Analog A2 Temperature & Humidity Sensor Digital D3 Air Pressure Sensor I2C I2C, 0x77(default) / 0x76(optional) 3-Axis Accelerator I2C I2C, 0x19(default) So I decided to show temperature, humidity, pressure, light and sound. I also added ability to show measurements on built-in oled display if you press button. Why the button press? In my experience, oled displays are prone to burn-in, and since main usage of this sensor board will be sending data to the cloud, it would be wasteful to destroy oled display which won't be used most of the time.
Programming Arduino sketch was easy using Groove Kit wiki pages which nicely document everything you will need to get you started. However, I noticed that wiki suggest to use Arduino libraries which have Grove in it's name, so I was wondering why is that so. Turns out that DHT11 temperature and humidity sensor and BMP280 temperature and pressure sensor use older version of Adafruit libraries which aren't compatible with latest versions on github. So, I tested latest versions from Adafruit and they work without any problems, just like Grove version. If you are already have them installed, there is no need to install additional Grove versions.
If you deploy sensor like this (probably connected to small Linux single board computer) it would be useful if it would be possible to update software on it witout need to run full Arduino IDE (and keyboard and mouse), so I decided to write a Makefile which uses and installs arduino-cli which is go re-implementation of support which is available in Arduino IDE, but written in go that enables usage from command-line (over ssh for example).
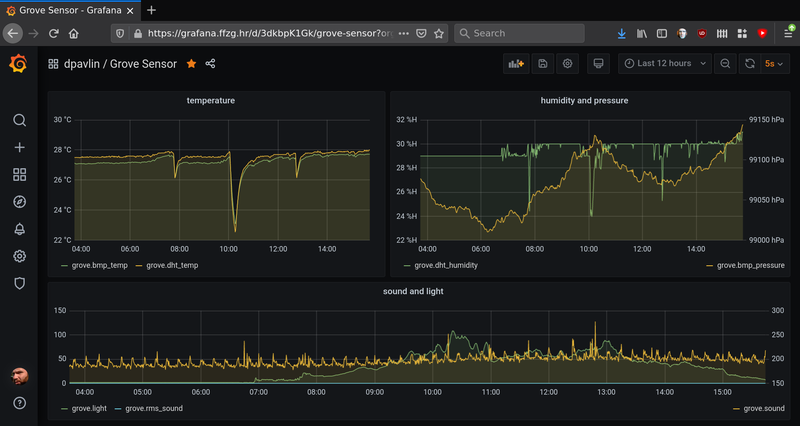
So if you are interested in trying this out, and want to get graphs similar to one above, go to GroveSensor github repository clone it to your Raspberry Pi, issue make to build it and make upload to send it to your board. You will also need to edit influx.sh to point it to your InfluxDB instance, and you can start creating graphs in Grafana. All this will also work on other platforms (like x86, amd64 or aarm64) thanks to arduino-cli install script.
-
ipmi serial console using grub and systemd
I must admit that Linux administration is getting better with years. I was configuring IPMI serial console on old machines (but with recent Debian) so I decided to find out which is optimal way to configure serial console using systemd.
First, let's inspect ipmi and check it's configuration to figure out baud-rate for serial port:
root@lib10:~# ipmitool sol info 1
Info: SOL parameter 'Payload Channel (7)' not supported - defaulting to 0x01
Set in progress                 : set-complete
Enabled                         : true
Force Encryption                : true
Force Authentication            : false
Privilege Level                 : ADMINISTRATOR
Character Accumulate Level (ms) : 50
Character Send Threshold        : 220
Retry Count                     : 7
Retry Interval (ms)             : 1000
Volatile Bit Rate (kbps)        : 57.6
Non-Volatile Bit Rate (kbps)    : 57.6
Payload Channel                 : 1 (0x01)
Payload Port                    : 623
Notice that there is 1 after info. This is serial port which is sol console. If you run ipmitool without this parameter or with zero, you will get error:root@alfa:~# ipmitool sol info 0 Error requesting SOL parameter 'Set In Progress (0)': Invalid data field in request
Don't panic! There is ipmi sol console, but on ttyS1!To configure serial console for Linux kernel we need to add something like console=ttyS1,57600 to kernel command-line in grub, and configuring correct serial port and speed:
GRUB_TERMINAL=serial
GRUB_SERIAL_COMMAND="serial --speed=57600 --unit=1 --word=8 --parity=no --stop=1"
All required changes to default configuration are below:root@lib10:/etc# git diff diff --git a/default/grub b/default/grub index b8a096d..2b855fb 100644 --- a/default/grub +++ b/default/grub @@ -6,7 +6,8 @@ GRUB_DEFAULT=0 GRUB_TIMEOUT=5 GRUB_DISTRIBUTOR=`lsb_release -i -s 2< /dev/null || echo Debian` -GRUB_CMDLINE_LINUX_DEFAULT="boot=zfs rpool=lib10 bootfs=lib10/ROOT/debian-1" +# serial console speed from ipmitool sol info 1 +GRUB_CMDLINE_LINUX_DEFAULT="console=ttyS1,57600 root=ZFS=lib10/ROOT/debian-1" GRUB_CMDLINE_LINUX="" # Uncomment to enable BadRAM filtering, modify to suit your needs @@ -16,6 +17,8 @@ GRUB_CMDLINE_LINUX="" # Uncomment to disable graphical terminal (grub-pc only) #GRUB_TERMINAL=console +GRUB_TERMINAL=serial +GRUB_SERIAL_COMMAND="serial --speed=57600 --unit=1 --word=8 --parity=no --stop=1" # The resolution used on graphical terminal # note that you can use only modes which your graphic card supports via VBE
So in the end, there is noting to configure on systemd side. If you want to know why, read man 8 systemd-getty-generator -
Playing video on WS2812 panel
It all started more than a week ago when I was given 10x10 panel of ws2812 leds designed to be broken apart into individual boards. I might have said at that moment: "It is a panel, it's just missing a few wires", and so this story begins...

It took me the whole day to add those few wires and turn it into panel.

I started testing it using Arduino Nano with wrong FastLED example (which supports just 4 ws8212) and wondered why I'm not getting the whole panel to light up. After some sleep, I tried Adafruit example, fixed one broken data out-in wire in middle of panel and I got this:

So, playing video on this panel should be easy now, right?
First, I had to make a choice of platform to drive the panel. While my 10x10 panel with 100 leds needed just 300 bytes for single frame, I didn't want to have a video sending device wired to it. So, esp8266 was logical choice to provide network connectivity to the panel without usb connection (which we still need, but just for power).
At first, I took the Lolin Node MCU clone, which doesn't have 5V broken out (why?), and its VIN pin has a diode between USB 5V pin and VIN, and diode voltage drop is enough to make ws2812 dark all the time.
Switching to Weemos D1 mini did help there, but what to run on it? I found some examples that where too clever for me (for 8x8 panel, they use jpeg and just decode single 8x8 block to show it which won't work for my 10x10 panel).
After a bit of googling, it seems to me that https://github.com/Aircoookie/WLED project is somewhat of Tasmota for WS2812 on ESP8266, so I decided to use it. While it's not designed to support WS2812 matrix but simple stripes, it has UDP realtime control which enables it to send 302 byte UDP packet (300 bytes of RGB data and two byte header).So I started writing scripts which are at https://github.com/dpavlin/WLED-video to first convert video to raw frames using something as simple as ff2rgb.sh:
dpavlin@nuc:/nuc/esp8266/WLED-video$ cat ff2rgb.sh
#!/bin/sh -xe

f=$1

test ! -d $f.rgb && mkdir $f.rgb || rm -v $f.rgb/*.png
ffmpeg -i $f -vf scale=10x10 $f.rgb/%03d.png
ls $f.rgb/*.png | xargs -i convert {} -rotate 180 -gamma 0.3 -depth 8 {}.rgb
To send frames I wrote simple send.pl script. I would have loved to be able to use bash udp support or some standard utility (like netcat or socat) to send frames, but null values in data didn't work well with shell pipes and I wasn't able to make it work.
I also figured out that I have to modify gamma values for my frames so that colors are somewhat more correct (I had flame video which had blue hues on it without gamma correction). This is somewhat strange because WLED does have gamma correction for colors turned on, but it doesn't help and turning it off also doesn't help. So, gamma correction in pre-processing it is...And since I already had perl script to send UDP packets, I decided to open ffmpeg from it and make single script ff2wled.pl which sends video to panel like this:
dpavlin@nuc:/nuc/esp8266/WLED-video$ ./ff2wled.pl rick.gif

Was it all worth it? Honestly, no. The panel is small enough that video playback is really too much for such small resolution and it would be so much easier to buy ready-made panel with more leds. But, I did learn a few tricks with ffmpeg, and hopefully somebody else will benefit from this post.
-
BalCCon 2k19 - So, is Android a Linux?
Last weekend I had pleasure to attend BalCCon 2k19 and present my talk So, is Android a Linux? which is embedded below. It was great conference and I hope that my talk gave some food for though and hints how to run Linux on Android devices.
-
Emulate IR remote for TV or HVAC from command-line using Tasmota
I don't have TV remote. I did get one, but as soon as I installed TV I realized that it's quite annoying to find remote to turn TV on when I sit with my wireless keyboard (computer is the only device connected to TV). So, I added keyboard shortcut using xbindkeys, addad IR led to Raspberry Pi, configured lirc and was happy about it. And then, buster with kernel 4.19 came and everything changed.
Send IR to TV
Upgrade to 4.19 kernel should be easy, only thing you have to do (if your IR sending diode is on pin 18) is to enable new overlay:
# pwm works only on 18
dtoverlay=pwm-ir-tx,gpio_pin=18
This does not work reliably for me on Raspberry Pi 1. My TV detect roughly every third key press and this makes command-line TV remote solution useless because you can use TV menus to setup picture any more.So, I had to do something. Getting up and pressing button on TV is not something that I can live with after having this automation working for year (and TV remote was missing by now). But, I had all required components.
Few weeks ago, I removed IR send/receive board from RMmini 3 and documented it's pinout:

I was also in the middle of flashing Sonoff-Tasmota to bunch of Tackin plugs so it seemed like logical step to flash Tasmota to NodeMCU board, connect RMmini 3 IR board to it and give it a try. And I'm glad I did.
I used to have http server (simple perl script) running on Raspberry Pi which used irsend to send IR codes. From xbindkey perspective, my configuration used curl and all I had to do to get IR working again was changing my script to use mosquitto instead of irsend:
mosquitto_pub -h rpi2 -q 2 -t cmnd/ir/IRSend -m '{"protocol": "NEC","bits": 32, "data": 0x20DF10EF}'At this point I realized that I can put this into .xbindkeyrc and contact esp8266 directly. This didn't work... You can't have double quotes in commands which are executed and I had to put it into shell script and call that.And to my amazement, there was noticeable difference in response time of TV. In retrospect, this seemed obvious because my TV nuc is much faster than Raspberry Pi, but this was probably the most unexpected benefit of this upgrade.
When I said that you have to connect IR receiver and sender on NodeMCU pins, you have to take care not to hit pins that have special purpose on power-up. For example, if you connect something that will pull to ground on powerup (IR led for example) to gpio0 esp8266 will stay in boot loader mode. gpio2 and gpio16 are led pins on nodemcu board, so don't use them (and define them as Led1i and Led2i in configuration).
Having LEDs configured in tasmota allows me to extend my shell script and blink led after IR code has been sent:
dpavlin@nuc:~$ cat tv-on.sh
#!/bin/sh
mosquitto_pub -h rpi2 -q 2 -t cmnd/ir/IRSend -m '{"protocol": "NEC","bits": 32, "data": 0x20DF10EF}'
mosquitto_pub -h rpi2 -q 2 -t cmnd/ir/LedPower -m 1
mosquitto_pub -h rpi2 -q 2 -t cmnd/ir/LedPower -m 0
Send IR to HVAC
By pure luck, just a few days latter, my friend wanted to control his ACs from computer. Again tasmota came to the rescue. Since HVAC support in tasmota will increase firmware size over 512Kb (which breaks OTA upgrade on 1Mb modules) it's not compiled in by default. However, you can edit sonoff/my_user_config.h and uncomment it:
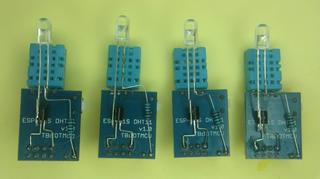
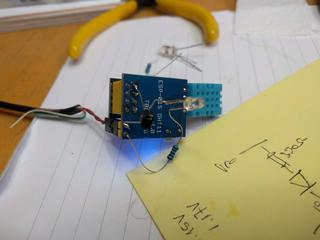
    #define USE_IR_HVAC                          // Support for HVAC systems using IR (+3k5 code)
    #define USE_IR_HVAC_TOSHIBA                  // Support IRhvac Toshiba protocol
    #define USE_IR_HVAC_MITSUBISHI               // Support IRhvac Mitsubischi protocol
    #define USE_IR_HVAC_LG                       // Support IRhvac LG protocol
    #define USE_IR_HVAC_FUJITSU                  // Support IRhvac Fujitsu protocol
    #define USE_IR_HVAC_MIDEA                    // Support IRhvac Midea/Komeco protocol
However, if you want to keep OTA update working, you will also have to turn off some other configuration options (I don't use Domoticz or Home Assistant) to keep firmware size below 512Kb.To create IR sender, I decided to add IR LED, transistor and resistor to existing ESP-01 module with DHT11 board (which has 3.3v regulator on it) according to the following DaveCAD(tm) drawing:

If you are wondering why I'm connecting IR led to RX pin (gpio3), it's because gpio0 is special, gpio2 is already used for dht11 and TX (which is gpio1) is also special. Since we don't need serial, using single pin left RX saves the day. And this is the picture of the first prototype (on which I tried all pins until I settled on RX):
With all this in place and quick re-flash, we where than able to issue commands like this to control AC:
mosquitto_pub -h rpi2 -t 'cmnd/ir/irhvac' -m '{ "Vendor": "Mitsubishi", "Power": 1, "Mode":"Cold", "Temp": 25}'

mosquitto_pub -h rpi2 -t 'cmnd/ir/irhvac' -m '{ "Vendor": "Mitsubishi", "Power": 0}'
So, with all this, I hope that you don't have any excuse not to control your IR devices from a command-line.Update: Just to make sure that you don't think this is my best soldering ever here is also picture of 4 more modules which will be distributed to my friends.